


Good news, your eyes aren’t playing tricks on you. What you’re seeing is called a flag pattern, and it’s actually one of the most useful clues in technical analysis.
If you’re into technical setups, you may also want to check out other essential crypto trading indicators.
Flag patterns help traders figure out if a coin is likely to keep moving in the same direction or take a breather. They might look simple, but when used right, they can give you solid entries and exits without needing a crystal ball.
In this post, we’ll break down what flag patterns are, how to spot them on a chart, and how to use them to trade smarter. Don’t worry if you’re not a chart expert, we’ll keep things simple and to the point.
Let’s get into it.
What Is a Flag Pattern in Crypto?
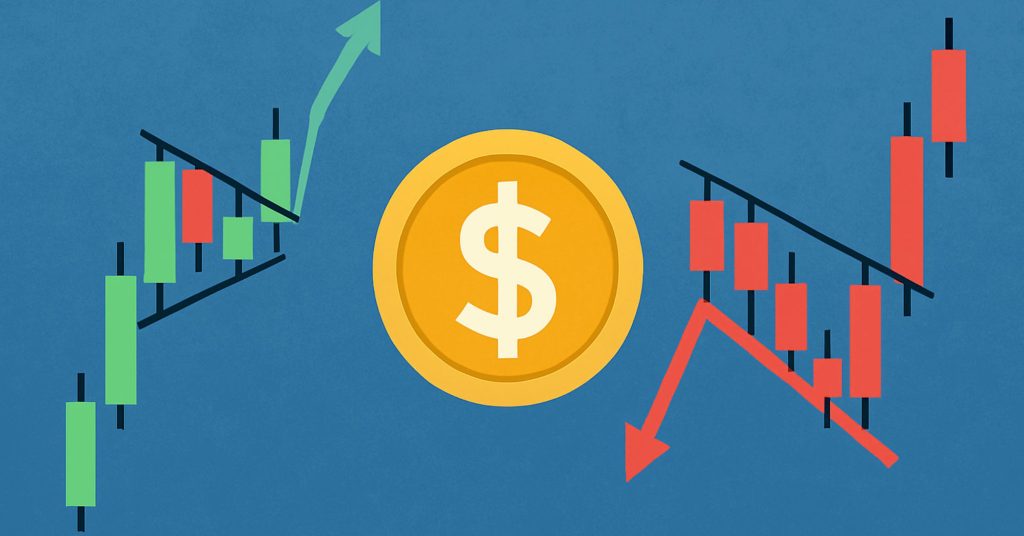
A flag pattern is a price formation that looks like, well… a flag. It happens when a coin makes a strong move in one direction (called the “flagpole”) and then pauses, trading in a tight range that looks like a small flag waving in the wind.
This pause isn’t a sign of weakness. It usually means the market is catching its breath before continuing in the same direction. Traders love flag patterns because they can be a signal that the trend still has more room to run.
They’re especially useful during meme coin season when prices can pump fast and retrace just as quickly.
There are two kinds of flag patterns, bullish and bearish. Bullish flags come after a strong upward move, and bearish flags follow a strong drop. They show up on all kinds of timeframes, from hourly charts to daily ones, and they work in both meme coin madness and big-cap crypto moves.
The Two Main Types of Flag Patterns
There are two flag patterns every crypto trader should know: the bull flag and the bear flag. They might sound like something out of a sports game, but they’re actually solid tools for spotting trend continuation.
Bull Flag
This one shows up after a strong price move upward. The “flagpole” is the big jump, followed by a small downward or sideways drift, that’s the flag. It usually means buyers are taking a short break before pushing the price higher again.
What it looks like:
- Sharp upward move
- Small pullback in a tight range
- Breakout often continues upward
Bear Flag
This is the flip side. A bear flag happens after a big drop. The price starts to move slightly up or sideways, but it’s usually just a pause before the next leg down.
What it looks like:
- Steep drop first
- Slight recovery or sideways action
- Breakdown often leads to more downside
These patterns show traders whether a trend is likely to keep going or reverse. Once you know what to look for, they start jumping out of the chart.
If you’re still learning, brush up on crypto slang terms so words like “bull flag,” “pump,” or “ranging” don’t leave you scratching your head.
How to Spot a Flag Pattern on a Chart
Flag patterns are easier to find than you might think, especially once you know the signs. They’re all about strong momentum followed by a brief cooldown.
Here’s how to spot one:
- Look for a strong move up or down with big volume, that’s your flagpole
- Then check for a small, tight range of price action that slopes slightly against the trend
- Draw trendlines around that range to form the “flag” shape
- Watch for a breakout from the flag, ideally with rising volume
You’ll see flag patterns most clearly on the 1-hour, 4-hour, or daily charts. Lower timeframes can work too, but they tend to show more noise.
Volume is key. A real flag pattern usually comes with high volume on the flagpole and lower volume during the flag. That shows momentum cooling off before it possibly fires up again.
If you’re serious about reading charts, you may want to explore swing trading strategies which often rely on patterns like flags and pennants.
How Traders Use Flag Patterns
Once you spot a flag pattern, the next question is simple: how do you trade it?
Most traders wait for the price to break out of the flag before jumping in. That breakout is seen as confirmation that the trend is ready to continue.
Here’s how a basic trade might look:
Entry: After the price breaks above a bull flag or below a bear flag
Stop-loss: Just outside the opposite side of the flag, to protect your position
Target: Measure the height of the flagpole and project that distance from the breakout point
For example, if a coin goes from $1 to $1.50 (flagpole) and then trades between $1.40 and $1.45 (flag), a breakout above $1.45 might signal a move toward $1.95.
It’s not a guarantee, but it gives you a plan, and in trading, that’s a big deal.
Want a more structured approach? Here’s our guide on meme coin trading strategies that include technical setups like this.
Common Mistakes to Avoid
Flag patterns are great tools, but they can fool you if you’re not careful. Here are some common mistakes that new traders make:
- Jumping in too early
- Forgetting volume
- Ignoring the bigger picture
- Using tiny timeframes
Being patient and checking all the signs helps you avoid jumping into patterns that aren’t really there.
Conclusion
Flag patterns might look small on the chart, but they can be powerful tools when used right. They help you spot moments when the market is taking a quick break before making its next move. Whether it’s a bull flag pointing up or a bear flag hinting at more downside, knowing how to read them gives you an edge.
The best part? You don’t need to be a chart wizard. Just learn the basics, practice spotting them on different timeframes, and always wait for confirmation before diving in.
Bonus tip: If you’re into automated strategies, check out the best crypto trading bots on Telegram, some can spot flag patterns for you.
