


A rice trader named Munehisa Homma developed this method in 18th century Japan. Today, traders worldwide use candlestick charts as their go-to tools. These visual representations of price movements give quick insights into market sentiment.
Crypto candlestick charts pack detailed data into simple visual elements. Each candle displays four significant price points – the opening price, closing price, and the highest and lowest prices during that period. Crypto markets never sleep, running 24/7. This means candlesticks show data for your selected timeframe instead of standard trading days. Becoming skilled at reading crypto charts helps you identify patterns that signal price movements. These movements can be bullish (upward) or bearish (downward).
This piece teaches you to spot single-candlestick and multiple-candlestick patterns. You’ll grasp the meaning of real bodies and wicks. These candlestick patterns show the constant tug-of-war between buyers and sellers. New traders and experienced ones alike will find these visual tools revolutionize their crypto market analysis.
What Is a Crypto Candlestick Chart and Why It Matters
Crypto candlestick charts are must-have tools that help you understand price movements in the cryptocurrency market. You’ll learn much more from candlesticks than simple line charts when you know how to read them properly.
A crypto candlestick chart shows how an asset’s price moves during specific time periods. Each candlestick displays four important price points: opening price, closing price, and the highest and lowest prices during that timeframe. This data helps you spot market sentiment and where prices might go next.
How candlestick charts visualize price action
Candlestick charts excel at turning complex price information into patterns you can spot right away. Each candlestick has two main parts:
The real body – This rectangular part shows the range between opening and closing prices. A longer body means stronger buying or selling pressure, while a shorter body hints at market uncertainty.
The wicks (shadows) – These thin lines stretch from the body’s top and bottom to show the highest and lowest prices of that period.
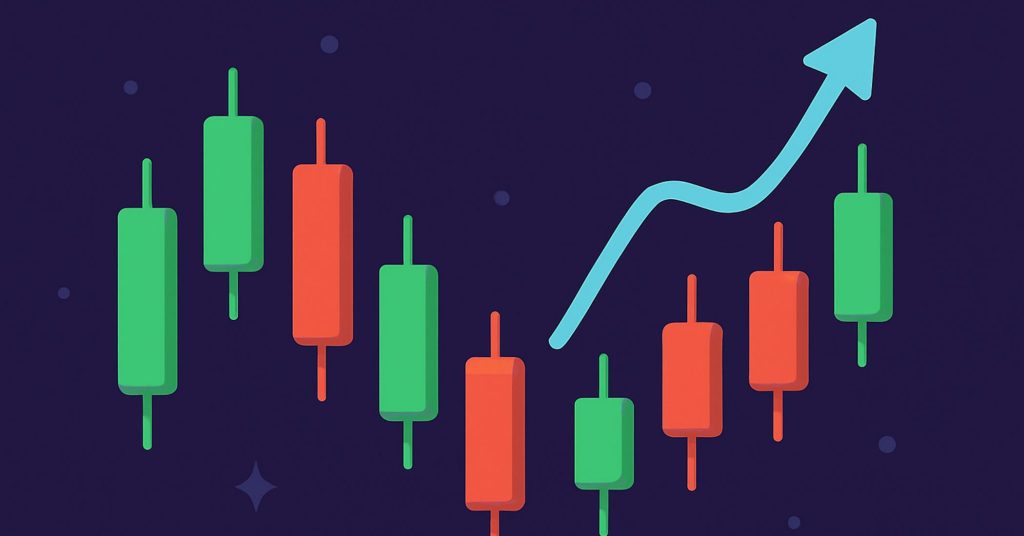
The candlestick’s color tells you which way prices moved. Green (or sometimes white) candles show bullish movement where prices closed higher than they opened. Red (or sometimes black) candles mean bearish movement where prices closed lower than they opened.
These charts shine at revealing market psychology. Long wicks might show price rejection at certain levels, and similar-sized candles could mean prices are consolidating before a big move. Traders often spot familiar patterns that help them predict where prices might go next.
You can adjust each candlestick’s timeframe based on your trading style—minutes work well for day traders while weeks suit long-term investors better. This lets you focus on quick price changes or step back to see bigger trends.
Crypto vs stock candlestick charts: key differences
While candlestick charts work the same way in all markets, crypto candlesticks have unique features compared to stock charts.
The biggest difference comes from crypto markets running 24/7, unlike stock markets with set trading hours. This means crypto candlesticks show non-stop price action without the overnight gaps you often see in stock charts.
Crypto markets also tend to be more volatile than traditional stock markets. Prices swing more dramatically in shorter periods, creating candlesticks with extreme wicks and larger bodies. The same patterns appear in both markets but develop faster and more dramatically in crypto trading.
Different factors drive these markets too. Stock candlestick patterns react to company performance, economic indicators, and market sentiment. Crypto patterns respond to market demand, how investors feel, and news about regulations. These different influences change how reliable certain patterns might be.
Trading volume changes a lot between cryptocurrencies, which affects pattern reliability. Popular stocks usually have steady trading volumes that make their patterns more reliable. Crypto assets often have changing volumes that affect how patterns form.
These differences matter when you’re trading crypto. You’ll read crypto candlestick patterns better once you understand what makes them unique.
Breaking Down a Single Candlestick
Becoming skilled at crypto trading starts with understanding how a single candlestick works. Each candlestick tells a micro-story of price action and contains four vital data points in one visual element. Let’s analyze these components to help you read crypto candlestick charts better.
Real body: open and close prices
The rectangular section called the real body or body stands out as the candlestick’s main feature. It shows the range between opening and closing prices during the time period. The body quickly reveals the price difference between open and close, and whether buyers or sellers dominated.
The body’s length reveals market psychology:
Long bodies show strong buying or selling pressure, which means either bulls or bears controlled that trading session
Short bodies point to market indecision or consolidation, where buyers and sellers remained balanced
New crypto traders should know that the body’s length shows the intensity of price movement between open and close—not the overall volatility (which wicks show).
Upper and lower wicks: price extremes
Wicks, shadows, or tails are thin lines that extend from the body. These parts show the complete trading range beyond opening and closing prices:
- Upper wick (shadow): Shows the highest price during that period
- Lower wick (shadow): Reveals the lowest price reached
Wick length plays a big role in reading crypto charts. Long wicks far from the body mean prices moved dramatically before pulling back. This could signal rejection of price levels or exhaustion of buying/selling pressure.
Minimal or no wicks suggest trading stayed close to open and close prices, which points to controlled price action. These candles often appear when volatility is low or price moves strongly in one direction.
The relationship between wicks and body offers deeper analytical insights. A small body with long wicks on both sides points to indecision and volatility. A large body with short wicks reveals decisive movement and strong conviction.
Bullish vs bearish candle colors
Colors give you quick visual signals about price direction in crypto candlestick patterns:
- Green (sometimes white) candles show bullish movement—closing price beats opening price
- Red (sometimes black) candles show bearish movement—closing price falls below opening price
The open and close prices’ position matters:
- Bullish (green) candles: Body’s bottom shows opening price, top shows closing price
- Bearish (red) candles: Body’s top shows opening price, bottom shows closing price
This setup instantly reveals whether buyers (bulls) or sellers (bears) won during that timeframe. Each candlestick represents a mini-battle between traders pushing prices up or down.
These simple components form your foundation to read complex crypto candlestick patterns. Single candles tell powerful stories—a long green candle with tiny wicks shows strong bullish conviction. A red candle with a long lower wick suggests sellers tried but failed to push prices down.
Once you grasp these elements, you’ll develop the visual skills to read candlesticks crypto charts with growing confidence and accuracy.
How to Read Crypto Candlestick Charts Like a Pro
Professional crypto traders set themselves apart from others by becoming skilled at three significant techniques beyond simple candlestick knowledge: picking the best timeframes, spotting single-candle reversals, and detecting multi-candle patterns. These skills will enhance your ability to read crypto candlestick charts effectively.
Choosing the right timeframe for your strategy
Your trading decisions and profits depend heavily on timeframe selection. Each timeframe serves a different trading approach:
Short-term timeframes (1-minute to hourly) – Day traders who make multiple trades daily prefer these charts. They show every price movement but include more market “noise” that might create false signals.
Medium-term timeframes (4-hour to daily) – Swing traders who keep positions for days or weeks find these intervals most useful. The charts reduce short-term volatility and show clearer trends.
Long-term timeframes (weekly to monthly) – Long-term investors who focus on major market movements rather than temporary changes value these intervals most.
Research shows cryptocurrency trading peaks between 10 AM and 11 AM Eastern Standard Time. Day traders might find shorter timeframes particularly valuable during this time window.
Your trading style, risk comfort level, and the cryptocurrency’s volatility should guide your timeframe choice. The timeframe you pick needs to match your investment goals and comfort zone.
Spotting trend reversals with single candles
Single candlesticks often signal upcoming trend changes. The most notable reversal candlesticks are:
The Hammer shows up in downtrends and hints at possible bullish reversals. It shows a small body near the top with a long lower wick. This pattern tells us sellers pushed prices down early, but buyers took charge by the close.
The Shooting Star appears during uptrends and warns of bearish reversals. It features a small body at the bottom with a long upper wick. Buyers drove prices up at first, but sellers dominated by the end.
A Doji forms when opening and closing prices look similar, creating a cross shape. Markets show uncertainty through this pattern, and it often signals a trend change when it follows a strong movement.
Reading multiple candles for pattern recognition
The strongest signals come from studying several candlesticks together. Experienced traders watch for:
Engulfing patterns happen when a bigger candle completely covers the previous one. A bullish engulfing after a downtrend shows buyers beating sellers, while bearish engulfing means the opposite.
The 3-candle rule offers a quick way to spot reversals. A bullish reversal shows this sequence: bearish candle, small/uncertain candle, bullish candle closing above the first candle’s open. Bearish reversals follow the opposite pattern.
These patterns work better when supported by other indicators like volume and support/resistance levels. New traders should practice finding these patterns on past charts before they start real trading.
Top Crypto Candlestick Patterns to Know
Pattern recognition plays a crucial role in crypto trading success. Traders who master crypto candlestick patterns gain a real edge in their trading decisions. Let’s get into the most reliable formations you need to know.
Bullish patterns: Hammer, Morning Star, Piercing Line
Hammer patterns show up at downtrend bottoms and hint at possible reversals. You’ll spot a small body at the top with a long lower wick that stretches at least twice the body length. The pattern tells us that sellers pushed prices down at first, but buyers took control later. This serves as a classic bullish signal whatever the small body’s color – green or red.
The Morning Star is a three-candlestick pattern that emerges after a downtrend. A long red candle leads the way, then comes a short-bodied candle that shows market uncertainty, and finally a strong green candle closes the pattern. This sequence represents a ray of hope in dark market conditions as the first day’s selling pressure fades. Traders often see this as their moment to buy.
A Piercing Line needs two candlesticks to form: a long bearish candle comes first, then a bullish one opens below the previous close but surges to finish above its midpoint. This shows buyers storming into the market with force.
Bearish patterns: Shooting Star, Evening Star, Three Black Crows
The Shooting Star looks like an upside-down hammer and pops up during uptrends. A small body sits at the bottom with a long upper shadow. This tells us buyers pushed prices up during the day, but sellers ended up winning.
An Evening Star works like a morning star in reverse and warns of bearish turns ahead. This three-candle pattern starts with a bullish candle, moves to a small indecision candle, and wraps up with a bearish candle. You’ll usually find it at the peak of uptrends.
Three Black Crows shows three long bearish candles in a row. Each opens within the previous candle’s range and closes lower than the last. This pattern reveals that sellers have taken firm control, and prices often keep falling afterward.
Neutral patterns: Doji, Spinning Top
A Doji takes shape when opening and closing prices match almost exactly, creating a cross shape. This shows a market in balance – neither side making headway. It points to market uncertainty but might signal a reversal after strong trends.
The Spinning Top has a small body with long shadows stretching both up and down about the same length. Like the doji, it shows market uncertainty as bulls and bears pushed prices both ways but settled close to where they started.
Where to Practice and Apply Candlestick Reading
Learning crypto candlestick patterns is just the beginning. You need reliable platforms to practice your new skills. The right tools make the biggest difference in how well you can read crypto candlestick charts.
Using TradingView for immediate crypto charts
TradingView is a revolutionary force in crypto candlestick pattern analysis. This powerful service gives you free access and premium subscriptions from $12.95 to $49.95 monthly. The platform’s value for beginners and experienced traders comes from its complete feature set:
- 10+ chart types and 90+ drawing tools help you see everything in price action
- 100+ pre-built technical indicators blend with your candlestick analysis
- Support for over 30 exchanges lets you track almost any cryptocurrency
TradingView goes beyond technical features. You can save customized chart layouts that match your trading style. The platform’s community features are a great way to get feedback from fellow traders, learn about their strategies, and watch professionals through live streams.
Charting tools on Binance and Coinbase
Binance and Coinbase’s built-in charting tools work right inside their trading platforms. These native solutions give you:
Time options that help you read crypto candlestick charts – from minute-by-minute data for day traders to weekly views for long-term investors
Trading volume data confirms potential candlestick signals
Exchange-based charts let you spot patterns and place trades instantly without switching platforms.
Practicing with demo accounts before live trading
Demo trading helps you become skilled at reading crypto charts without risk. Virtual funds let you:
Test pattern recognition without worrying about collateral damageBuild confidence while experiencing market swingsExecute trades based on specific candlestick formations
Most platforms offer demo accounts that look exactly like live trading accounts. This ensures you’ll feel comfortable when you switch to real money. Your trading journal should track each pattern you spot and document your trade results.
Conclusion
Reading crypto candlestick charts helps you direct your cryptocurrency trades with confidence. This piece shows how these visual tools compress vital price data into simple patterns that reveal market psychology. Candlestick charts have proven their worth from their 18th century Japanese roots to today’s round-the-clock crypto markets.
The core elements of candlestick analysis work as one to tell the price story. The real body displays open and close prices, while wicks show price extremes. Colors mark the direction. These components let you see the constant tug-of-war between market buyers and sellers.
Your trading style will shape which timeframes and patterns work best. Short-term traders often look at brief intervals and quick reversal signals like Hammers and Shooting Stars. Long-term investors might find more value in weekly charts and patterns like Morning and Evening Stars.
Testing these methods on TradingView or demo accounts makes sense before using real money. You can sharpen your pattern recognition skills without risking funds. Using candlestick analysis with other indicators often gives stronger confirmation signals.
Becoming a skilled trader takes time and practice. Your chart reading abilities will improve as you spot these patterns in different market conditions. While no trading method guarantees profits, knowing candlestick analysis gives you a solid base to make smarter trading choices in crypto’s volatile world.
